The United Nations World Tourism Organization (UNWTO) releases an annual report on global travel and tourism, and the 2018 edition has just come out. The report looks at tourism trends around the world and, among other measures, tracks increases and decreases in tourism activity across countries and regions. Here is what this year’s report found.
In total, international tourism arrivals grew to just over 1.3 billion in 2017, a 6.8% from 2016. That was the largest single-year percentage increase in this specific figure since 2009.
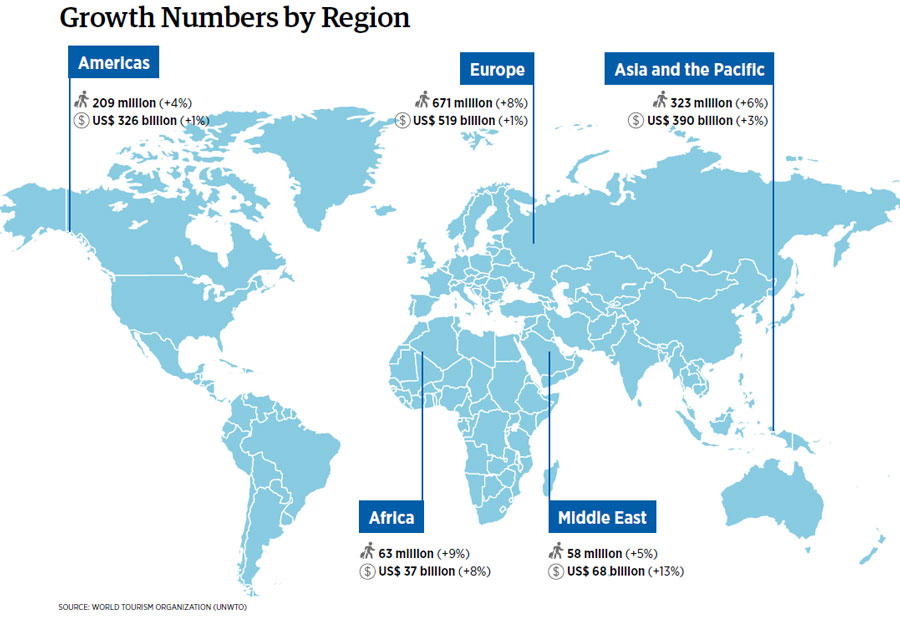
The two regions with the largest growth were Africa, with 9%, and Europe, with 8%. What’s stunning about those numbers, though, is that Europe received over half the world’s international tourism arrivals, 671 million, while Africa received less than a tenth of that amount, just 63 million.
European travelers accounted for 48% of outbound tourism followed by those from Asia-Pacific, with 25% of the total, the Americas at 17%, the Middle East with 3%, Africa with 3%, and 4% not reporting their origin.
International tourism spending was also up 5% globally and hit $1.34 billion. Nearly 40% of that figure came from spending in Europe, followed by Asia-Pacific with 29% and the Americas with 24%.
Who is spending all that money? The report found that Chinese outbound travelers spent nearly a fifth of it – $258 billion – while U.S. travelers came in second, with $135 billion. The report also noted that seven destinations ranked in the top 10 both in terms of arrival numbers and receipts (spending).
The main mode of transport for all these arrivals was by air, at 57%, followed by road at 37%, water at 4% and rail with just 2%. Leisure accounted for 55% of visits while business came in at just 13%. The other visits were either not specified, or for a variety of reasons like visiting relatives, health needs, or religious observance.
Here were the destinations that saw the most growth in terms of year-over-year percentage increase of visitors:
1. Egypt: 55.1%
2. Togo: 46.7%
3. Vietnam: 29.1%
4. Georgia: 27.9%
5. Palestine: 25.7%
6. Niue: 25.4%
7. Nepal: 24.8%
8. Israel: 24.6%
9. Northern Mariana Islands: 24.3%
10. Iceland and Turkey (tie): 24.1%
Then, for contrast, here were the top 10 destinations in terms of overall visitor numbers for 2017:
1. France: 86.9 million
2. Spain: 81.8 million
3. United States: 75.9 million
4. China: 60.7 million
5. Italy: 58.3 million
6. Mexico: 39.3 million
7. United Kingdom: 37.7 million
8. Turkey: 37.6 million
9. Germany: 37.5 million
10. Thailand: 35.4 million
Finally, here is the list of countries with the top spenders on outbound tourism:
1. China: $257.7 billion
2. United States: $135 billion
3. Germany: $89.1 billion
4. United Kingdom: $71.4 billion
5. France: $41.4 billion
6. Australia: $34.2 billion
7. Canada: $31.8 billion
8. Russian Federation: $31.1 billion
9. Republic of Korea: $30.6 billion
10. Italy: $27.7 billion
One final takeaway: four out of five tourists traveled within their own region. So as regions like Asia and Africa further develop their tourism sectors and infrastructures, we should see their numbers balloon in the coming years, both in terms of visits and spending.


